In early 2021 we released our Playbook Debugger for Palo Alto Networks Cortex XSOAR product and research played a strong role in it.
Due to a data-driven approach and continuous validation process we spent large engineering effort wisely and managed to avoid a lot of pitfalls and save thousands of hours of potential design and engineering rework (which is so costly and time-consuming). Research helped us to maximize user value with the first release.
This project was born when we noticed that our Customer Success team spends a lot of time trying to test Playbooks. We thought that we could make their life easier by releasing Debugger, but we didn’t know whether this feature will make an impact outside of our team. The estimated engineering effort was quite large, and it was not easy for us to commit to such a big product investment without getting more data.
To get more clarity we did the discovery research with our customers.
20+
Design Partners
60+
Interviews Conducted
40+
Beta Participants
1. DISCOVERY
With this Discovery phase we wanted to learn:
- What is the actual user need? (do they really want a “Debugger” or just a “Troubleshooting” tool or something completely different?)
- How big is this need? (Do our users want this feature?)
- Are there segments (groups of customers) who may need this more than others or do not need it at all?
So we started with the research plan that contains open-ended questions, and lets our users communicate their unique experience and their needs. We conducted around 20 interviews, and to our surprise, we discovered that inability to efficiently troubleshoot issues was the biggest Pain Point among our customers (as well among our Customer Success team).
But our Discovery research didn’t end there. While analyzing research reports we noticed that different users want to troubleshoot their playbooks in different product areas. We quickly ran a questionnaire across our users to determine the most important debugging scenario for them.
We found out that there are 2 scenarios where our users may need to debug the code the most:
- In the “Incident View” page, when an error occurs in the system, so the data is not displayed as it should.
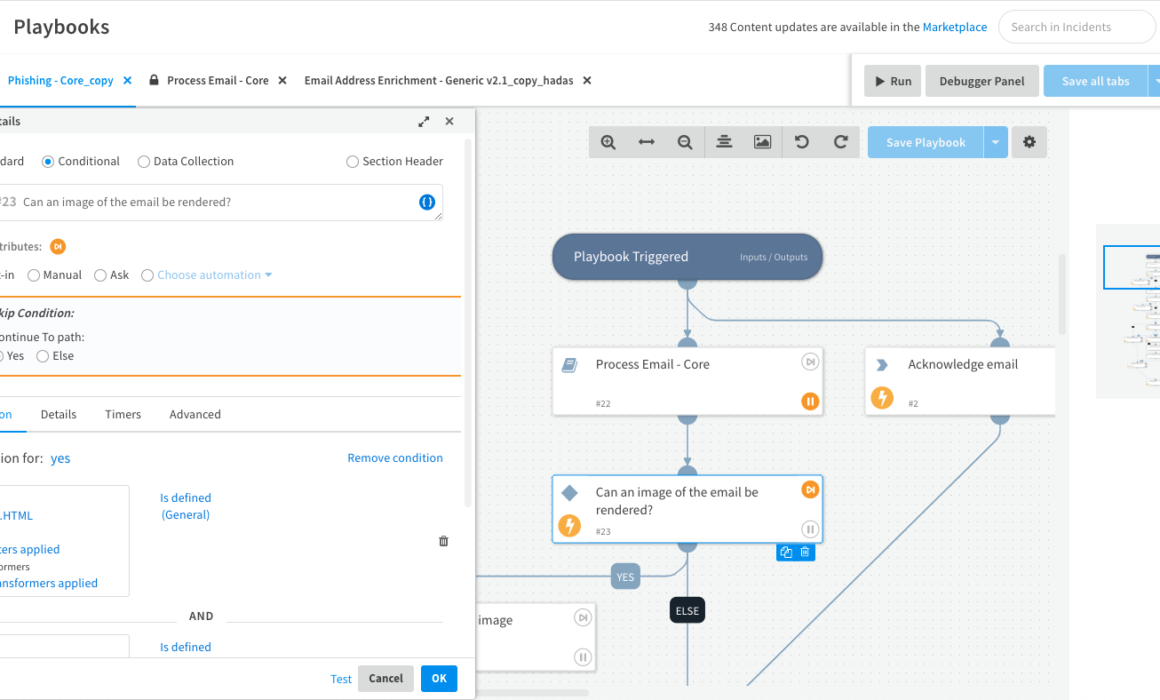
- In the “Playbook Builder”, when a playbook is being built, so the user needs to overwrite context data as a part of playbook building exercise.
Each of these scenarios required a separate design and engineering effort. We communicated out findings to the PM team and collaboratively narrowed down the potential work, so we stayed focused on the features that matter the most. We decided to take different approaches to solve these discovered issuess, and one of them was building Playbook Debugger. We chose a different way to solve the “Troubleshooting” pain point.
2. Product Idea Validation
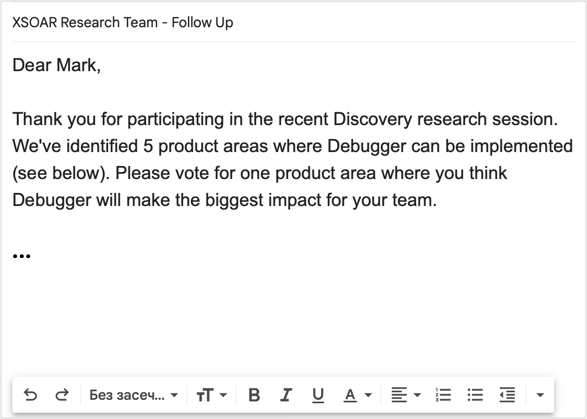
After research helped us to identify product areas where users wanted Debugger the most, we conducted a series of conversational sessions with our users, asking them how would they imagine “Playbook Building” workflow, and we were surprised to how much congruent and fulfilling were people’s responses:
- “I would like to set breakpoints within actual Playbook to see what the inputs are, as well as set Breakpoints within a Sub Playbook.“
- “I’m a command line type of guy, I have experience in Perl and Python debuggers, I’d like to see that kind of interface where we can set breakpoints, examine and watch variables, watch registers, change code and alter the flow of things, so we can see behavior of different branches…“
- “My expectations would be to set breakpoints, step through the tasks in Sub Playbooks, inspect context along the way.“
- Etc.
Together with Product Management team we analyzed these responses and decided on which features we should be designing, and which ones we should put on hold.
3. Design Validation
Our UX team created Debugger design mockups and we validated them to make sure that we are not missing any important details like steps in the flow, interactions, etc.
More discussions we did, more missing pieces we discovered. There were moments when our assumptions were significantly different from what the research results revealed.
For example, there was a “debug” button in the initial design. We imagined “debug” as a separate mode, which appeared to be not what our users wanted. If we released the feature as it was initially designed, we would have run into so many problems:
- Reenter same data multiple times every time there is a change.
- Need to create/apply/modify transformers each time there is a change.
- Need to switch between edit and debug mode constantly.
- Unpleasant user experience, requires extra clicks.
- Etc.
We didn’t know any of this until we started the validation. And the research helped us learning about the gap before engineering effort was spent.
Design validation raised many functional questions that we haven’t thought about, and the main value of the research at these stage was not to answer these questions, but to get the teams to be aware and aligned on these questions .

Two months after the start of the research, we had much better understanding of a Debugger complexity specific to a SOAR product. We continued to collaborate closely with the PM team on functional areas the debugger should cover.
4. Building Better Flows
Debugger workflows designed by our teams were extremely reach with interactions and co-depencies of data. Debugger elements could behave differently depending on the situation, testing data and conditions applied.
We would validate every piece of our design to make sure that it doesn’t cause any new issues.

The user’s feedback was so valuable, as it helped us to think trough most of the edge cases:
- “Are you forcing execution on the left branch or on the right branch?”
- “Do I need to re-enter my data in this box”?
- “Is this data saved in the context panel?”
- “I would not expect the value to be actually override if I save the Playbook.”
- “If the output is interpreted by the job as an array, how would you represent that?”
These small details had a major impact on the usability of our product. And the only way to reveal these detail was through doing UX research.
5. Iterative Design Changes
We involved our customers into our design sprints. User Inputs were so precious and eye-opening in validating design assumptions:
- “If an error occurs it is usually only occurs on a very specific Incident Type, so I need to be very specific in which data I use for testing.”
- “From my experience I’ve noticed that when I try to update mapping data its difficult to get the exact information from the specific case, which is open or assign to me, if there is an ability to choose a case for testing/debugging, that will make my life much easier”
- “Specifying an Incident ID for debugging in UI would be much more convenient than exporting and importing JSON”
An image below shows the Evolution of a “Testing Data” panel design.
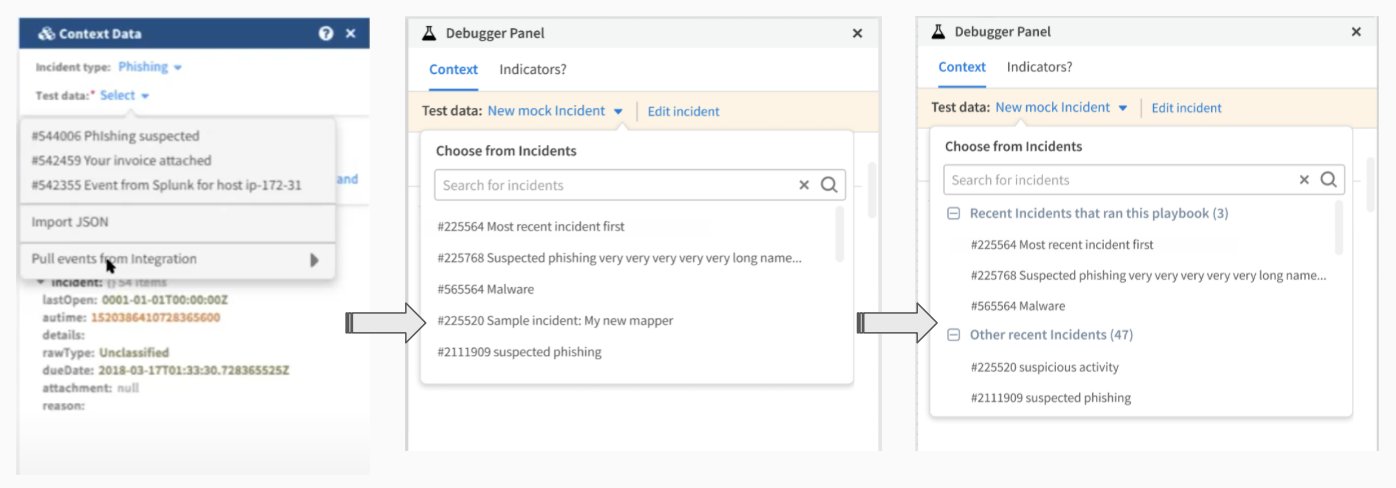
Iteration1: Product Team had an initial assumption that displaying 3 randomly generated incidents would be sufficient for users to pick one.
Iteration2: Based on user feedback (see above) we saw a need to add a search box, where users can enter the Incident ID or Incident Name.
Iteration3: After we did the demo of the updated search box functionality, users shared with us that it is easy to make a mistake if only numeric value is shown, so they would want to see which Incident Type is it, as well as well as the info, whether this Incident run by this Playbook.
7. Design Elements
We thought that it would be necessary to validate also our high-fidelity design elements.
Despite certain time-proven icon conventions for Debugger products, we decided to learn what is more intuitive for users, and build our designs based on our learnings, rather than just following these conventions blindly.

As an interesting example of an outcome of the user feedback cycle, we replaced “step into/out/over” button bar (left image) with the contextual navigation “Open sub playbook” link (right image), see below:

We found out that this link was sufficient and there was no learning curve, compared to the button bar.
8. Prototype Validation
By this time we had an impressive amount of customers who were continuously participating in all rounds of our Debugger research project, so we invited them to try our Debugger Beta and provide their feedback.
Our customers helped us to find the design flaws that we missed in mockups, the users expected a different behavior than we prototyped:
- “So when I overrode it, i junked the whole input, I didn’t mean that. I only wanted to get rid of the information in the box.”
- “That’s another thing. When I stop it, I don’t want to reset it back to this value. Show me the execution. The green box shall be here.”
- “I’m looking for it first, that’s what I was afraid of. A lot of time it displays the previous value. I’m expecting it to show me the executed value.”
- “One thing I’m noticing here is that if I want to override a dropdown. I’m not getting same override feature as I have for the label.”
RESULTS
- Debugger came out a genuinely successful XSOAR feature. Most of our end users liked the released Debugger feature. Our customers positively mentioned Playbook Debugger in consecutive UX research sessions as their main delight in Cortex XSOAR product.
- We saved a lot of engineering effort by validating our assumptions. If we didn’t do research and implemented debugger in a separate mode, we would have ended up with a lot usability problems (see above), that would have been almost impossible to fix locally.
- We’ve learned how to do UX research as a team, and created a repeatable research practice that helped doing next research projects faster.
I love the PB debugger. I followed the design process as much as possible. Fantastic job & result! Many thanks for all your work.